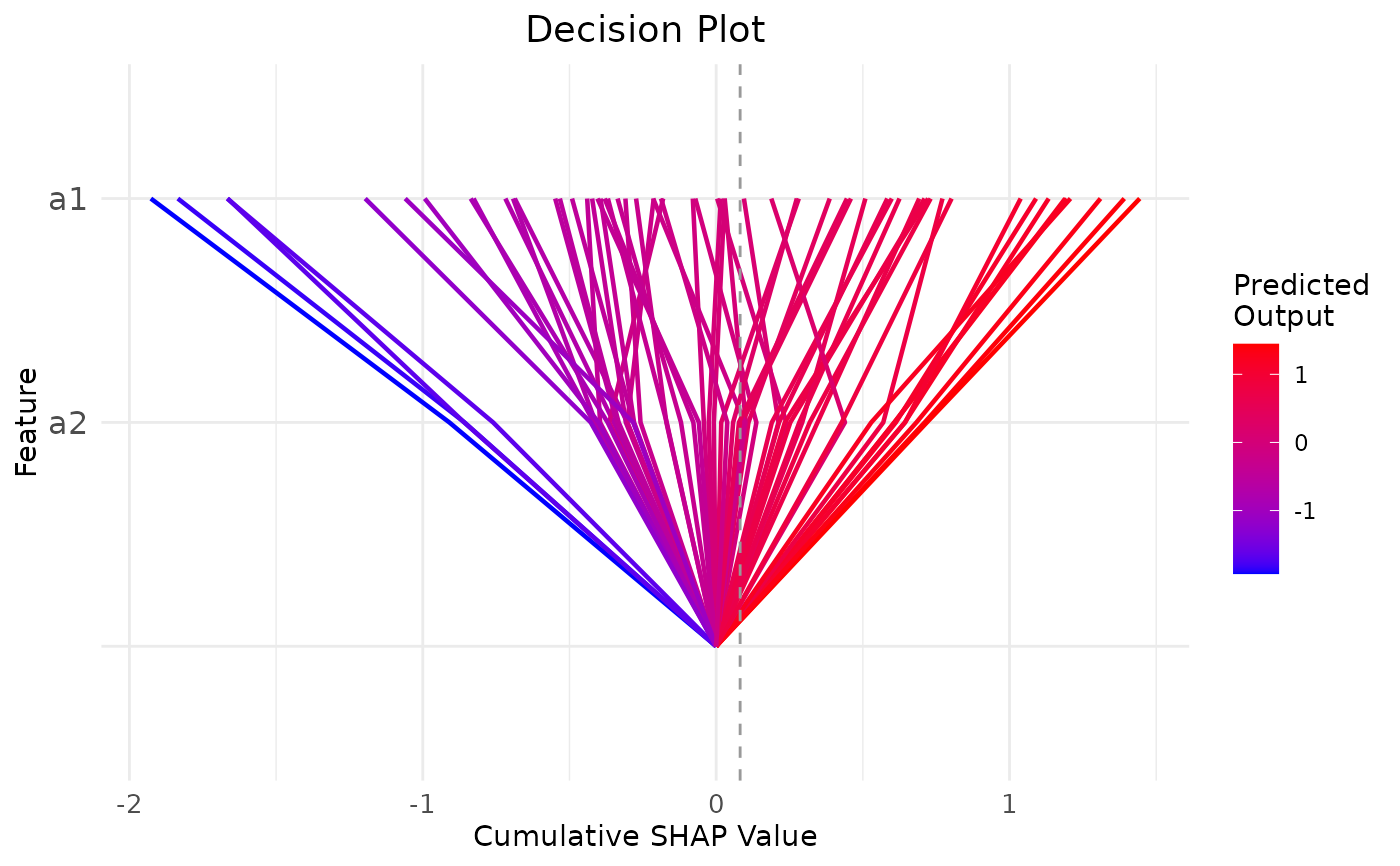
Creates a cumulative SHAP decision plot adapted from the Python shap
package.
Usage
plot_decisions(object, ...)

# S3 method for class 'mossy_forest'
plot_decisions(
  object,
  highlight = NULL,
  just_shap = FALSE,
  plot_title = "Decision Plot",
  geom_point = FALSE,
  gradient = c("blue", "red"),
  ...
)
Arguments
- object
A
mossy_forestobject. Ifjust_shap = TRUE, pass a data frame of SHAP values instead.- ...
Ignored.
- highlight
Row indices or feature names to highlight.
NULLshows all observations. DefaultNULL.- just_shap
If
TRUE,objectis treated as a plain SHAP data frame. DefaultFALSE.- plot_title
Plot title. Default
"Decision Plot".- geom_point
Add a point at each feature step? Default
FALSE.- gradient
Length 2 color vector for the prediction gradient. Default
c("blue", "red").
Examples
# A small simulated regression problem with two modules of features
set.seed(1)
n <- 60
z <- rnorm(n)
X <- data.frame(a1 = z + rnorm(n, sd = 0.3), a2 = z + rnorm(n, sd = 0.3),
                a3 = z + rnorm(n, sd = 0.3), b1 = rnorm(n), b2 = rnorm(n),
                b3 = rnorm(n))
y <- z + rnorm(n, sd = 0.3)
membership <- c(a1 = "A", a2 = "A", a3 = "A", b1 = "B", b2 = "B", b3 = "B")

# The pure R backend needs no Python installation
fit <- mf(X, y, module_membership = membership,
          screen_params = screen_control(min_ntree = 50),
          select_params = select_control(n_reps = 10, min_ntree = 50),
          final_ntree = 50, backend = "R", r_shap = "treeshap", verbose = 0, seed = 1)
plot_decisions(fit)