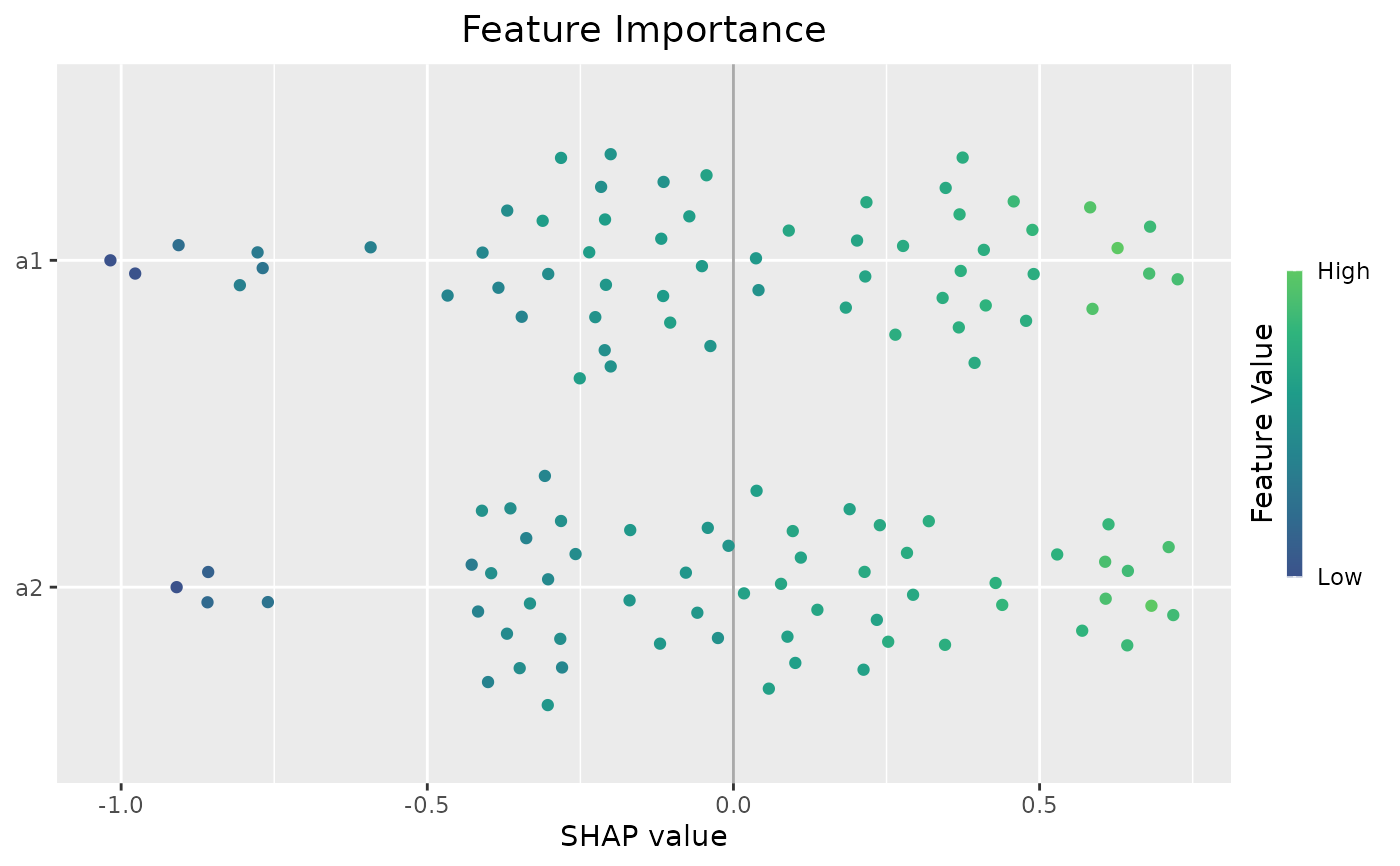
Generates a feature importance plot from a mossy_forest object.
Three plot types of bar, beeswarm, and both can be used. Plots are built
via shapviz.
Usage
plot_importance(object, ...)

# S3 method for class 'mossy_forest'
plot_importance(
  object,
  kind = "beeswarm",
  color_bar_title = "Feature Value",
  max_display = NULL,
  fill = "#3e568a",
  sort_features = TRUE,
  show_numbers = TRUE,
  viridis_args = list(begin = 0.25, end = 0.75, option = "viridis"),
  ...
)
Arguments
- object
A
mossy_forestobject.- ...
Ignored.
- kind
Plot type:
"bar","beeswarm", or"both". Default"beeswarm".- color_bar_title
Title for the color bar in the beeswarm plot. Default
"Feature Value".- max_display
Maximum number of features to display.
NULLshows all. DefaultNULL.- fill
Bar/point color Any valid
ggplot2color or hex code. Default"#3e568a".- sort_features
Sort features by importance? Default
TRUE.- show_numbers
Show numeric SHAP values on the bar plot? Default
TRUE.- viridis_args
Named list of arguments forwarded to
viridisfor the beeswarm color scale. Defaultlist(begin = 0.25, end = 0.75, option = "viridis").
Examples
# A small simulated regression problem with two modules of features
set.seed(1)
n <- 60
z <- rnorm(n)
X <- data.frame(a1 = z + rnorm(n, sd = 0.3), a2 = z + rnorm(n, sd = 0.3),
                a3 = z + rnorm(n, sd = 0.3), b1 = rnorm(n), b2 = rnorm(n),
                b3 = rnorm(n))
y <- z + rnorm(n, sd = 0.3)
membership <- c(a1 = "A", a2 = "A", a3 = "A", b1 = "B", b2 = "B", b3 = "B")

# The pure R backend needs no Python installation
fit <- mf(X, y, module_membership = membership,
          screen_params = screen_control(min_ntree = 50),
          select_params = select_control(n_reps = 10, min_ntree = 50),
          final_ntree = 50, backend = "R", r_shap = "treeshap", verbose = 0, seed = 1)
plot_importance(fit)