Plot Shadow Stability Selection Curves for a Mossy Forest Object
Source:R/shapff_plot.R
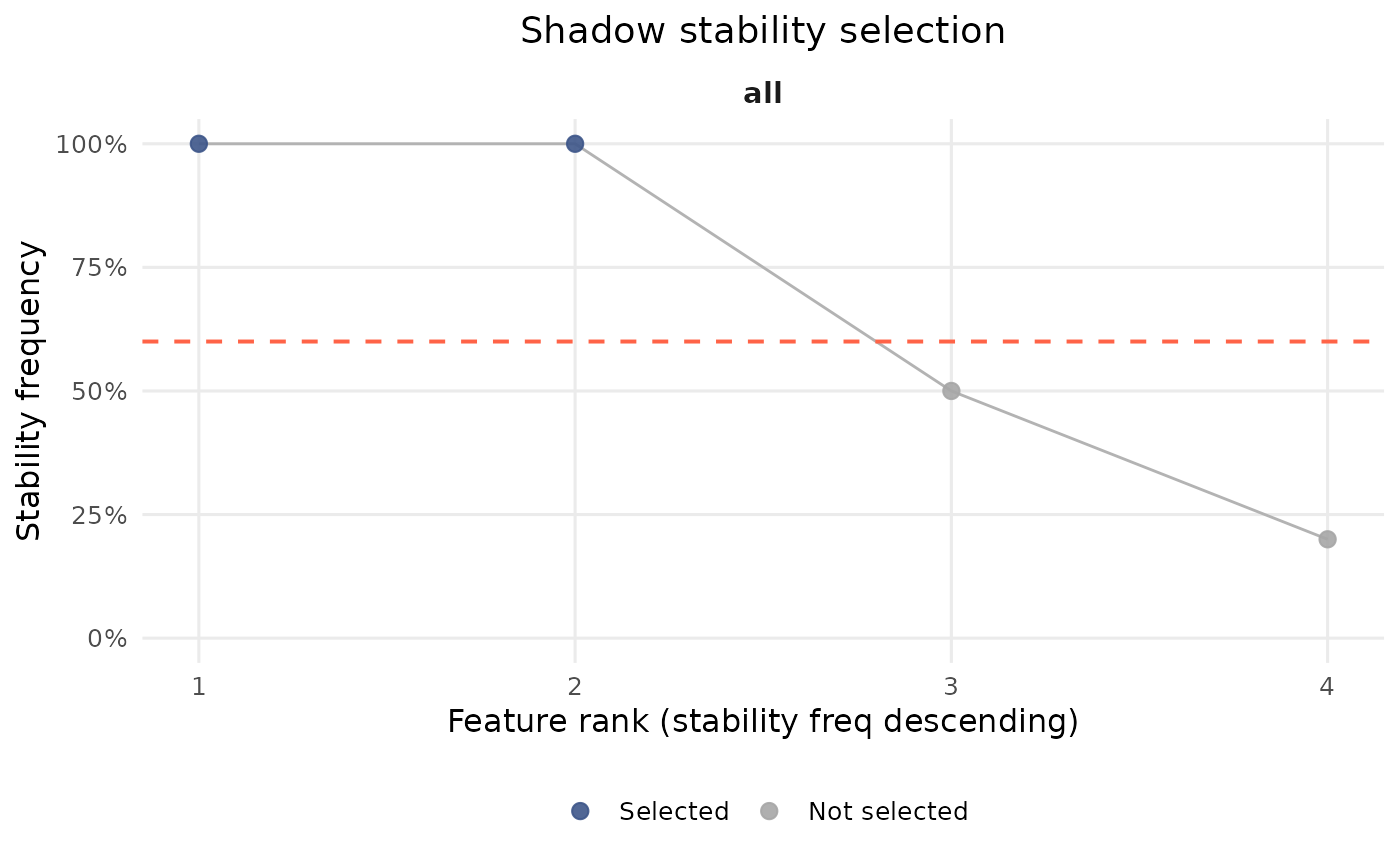
plot_stability_elbow.RdDisplays the shadow subsample stability frequency curve for each selection pool with a horizontal threshold line and colored points indicating which features were selected.
Usage
plot_stability_elbow(object, ...)

# S3 method for class 'mossy_forest'
plot_stability_elbow(
  object,
  col_selected = "#3e568a",
  col_unselected = "grey65",
  col_threshold = "tomato",
  col_elbow = "#e07b00",
  show_labels = FALSE,
  ncol = NULL,
  main = "Shadow stability selection",
  ...
)
Arguments
- object
A
mossy_forestobject.- ...
Ignored.
- col_selected
Point color for selected features. Default
"#3e568a".- col_unselected
Point color for unselected features. Default
"grey65".- col_threshold
Color of the horizontal threshold line. Default
"tomato".- col_elbow
Color of the vertical elbow rank line. Default
"#e07b00".- show_labels
Show feature names on points. Default
FALSE. SetTRUEonly for small pools (\(p \le 20\)).- ncol
Number of columns in the facet grid.
NULLlets ggplot choose. DefaultNULL.- main
Plot title. Default
"Shadow stability selection".
Details
For shadow_mode = "split", there is one panel for the
correlated pool and one for the unassigned pool (elbow or fixed threshold).
For shadow_mode = "within_module" one panel is shown per module.
The dashed red line marks the stability threshold applied. For unassigned pools with elbow detection the elbow rank is marked with a vertical dotted line.
Methods (by class)
plot_stability_elbow(mossy_forest): Stability elbow plot for amossy_forestobject.
Examples
# A small simulated regression problem with two modules of features
set.seed(1)
n <- 60
z <- rnorm(n)
X <- data.frame(a1 = z + rnorm(n, sd = 0.3), a2 = z + rnorm(n, sd = 0.3),
                a3 = z + rnorm(n, sd = 0.3), b1 = rnorm(n), b2 = rnorm(n),
                b3 = rnorm(n))
y <- z + rnorm(n, sd = 0.3)
membership <- c(a1 = "A", a2 = "A", a3 = "A", b1 = "B", b2 = "B", b3 = "B")

# The pure R backend needs no Python installation
fit <- mf(X, y, module_membership = membership,
          screen_params = screen_control(min_ntree = 50),
          select_params = select_control(n_reps = 10, min_ntree = 50),
          final_ntree = 50, backend = "R", verbose = 0, seed = 1)
plot_stability_elbow(fit)