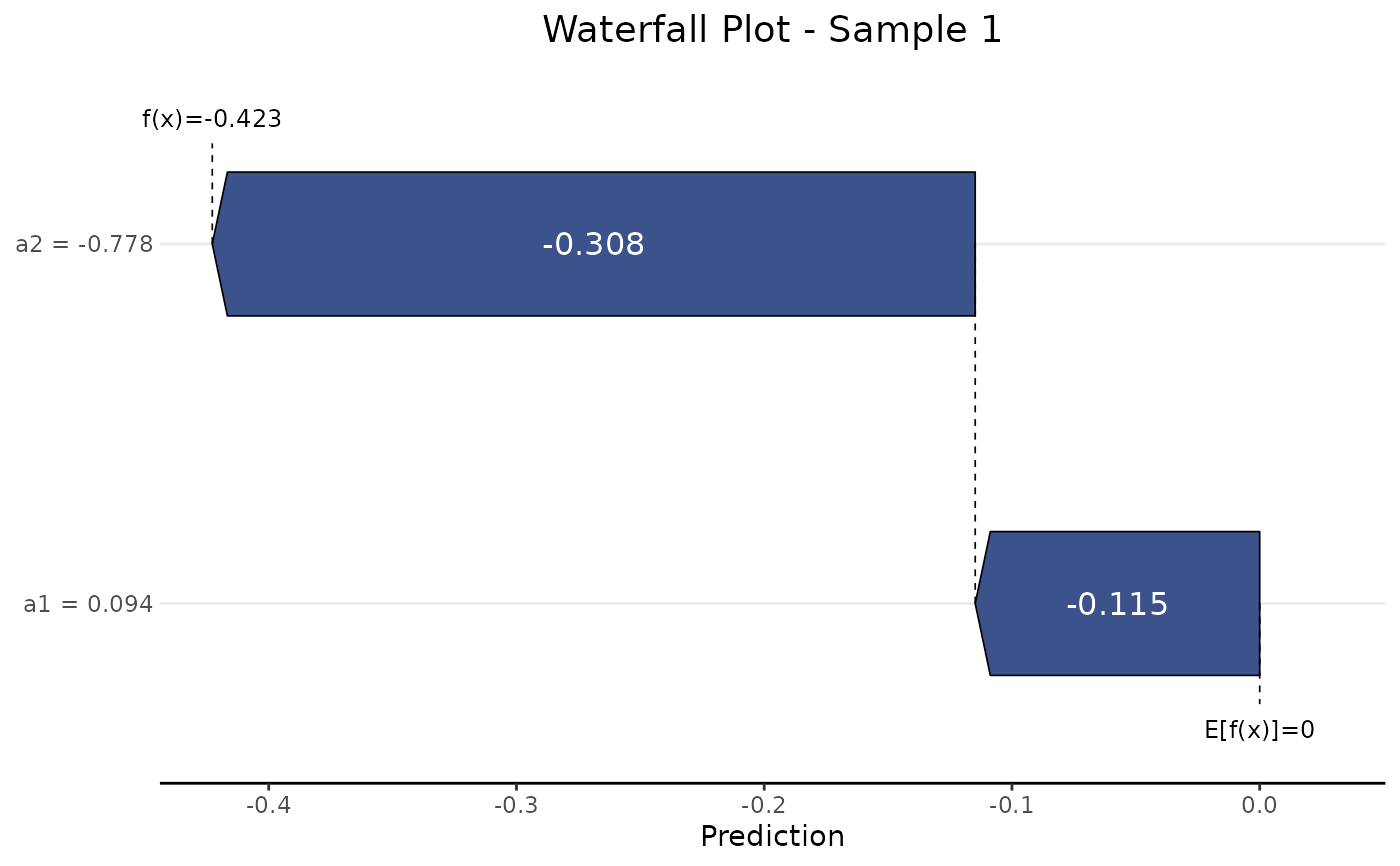
Plot Waterfall for Specific Observations in a Mossy Forest Object
Source:R/shapff_plot.R
plot_waterfall.RdGenerates a SHAP waterfall plot for one or more observations. Plots are built via shapviz.
Arguments
- object
A
mossy_forestobject.- ...
Ignored.
- row_id
Row index (or indices) for the observation(s) to plot. When multiple indices are given, SHAP values are averaged.
- row_name
Optional name(s) for the observation(s).
- max_display
Maximum number of features to display.
NULLshows all. DefaultNULL.- order_fun
Function used to order features. Default orders by absolute SHAP value.
- fill_colors
Length 2 vector of colors for positive/negative bars. Default
c("#59c46b", "#3b528b").- contrast
Apply text/arrow contrast? Default
TRUE.- show_connection
Show connections between bars? Default
TRUE.- show_annotation
Annotate bars? Default
TRUE.
Examples
# A small simulated regression problem with two modules of features
set.seed(1)
n <- 60
z <- rnorm(n)
X <- data.frame(a1 = z + rnorm(n, sd = 0.3), a2 = z + rnorm(n, sd = 0.3),
                a3 = z + rnorm(n, sd = 0.3), b1 = rnorm(n), b2 = rnorm(n),
                b3 = rnorm(n))
y <- z + rnorm(n, sd = 0.3)
membership <- c(a1 = "A", a2 = "A", a3 = "A", b1 = "B", b2 = "B", b3 = "B")

# The pure R backend needs no Python installation
fit <- mf(X, y, module_membership = membership,
          screen_params = screen_control(min_ntree = 50),
          select_params = select_control(n_reps = 10, min_ntree = 50),
          final_ntree = 50, backend = "R", r_shap = "treeshap", verbose = 0, seed = 1)
plot_waterfall(fit, row_id = 1)